Bitcoin should be treated as a commodity, like gold: Cantor Fitzgerald CEO
On Sept. 27, Howard Lutnick, the CEO of financial Cantor Fitzgerald, appeared on Fox Business …
Read More
On Sept. 27, Howard Lutnick, the CEO of financial Cantor Fitzgerald, appeared on Fox Business …
Read More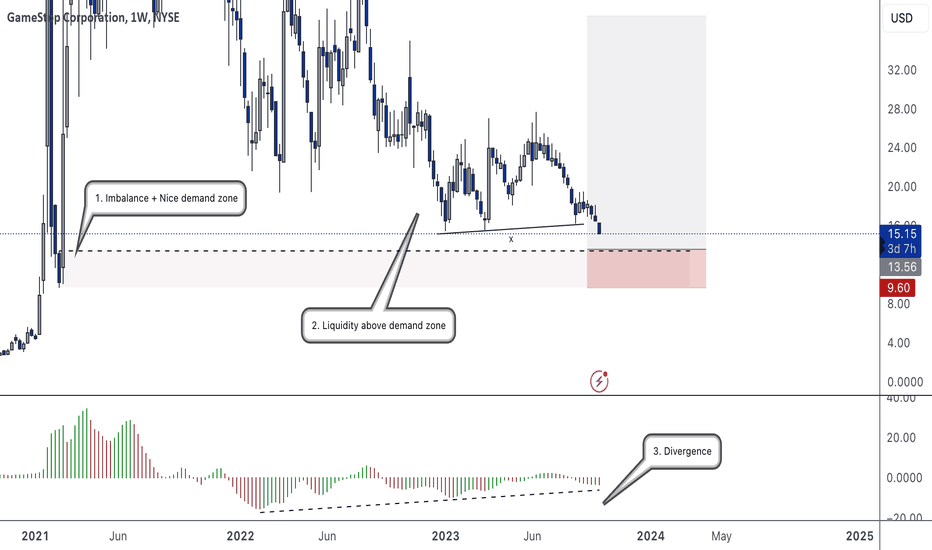
I recently seen an article about Game Stop being at its lowest level of the year so i decided to glance at the technicals. From a Technical standpoint it looks pretty good. Here are a few reasons why i think this: 1) Price is approaching a nicely unmitigated demand zone. 2) The demand zone created a great deal of imbalance 3) There is liquidity above the demand zone. 4) There is divergence playing out. When price approaches the demand i may look for some calls depending on how momentum shifts on the lower time frams.
Read More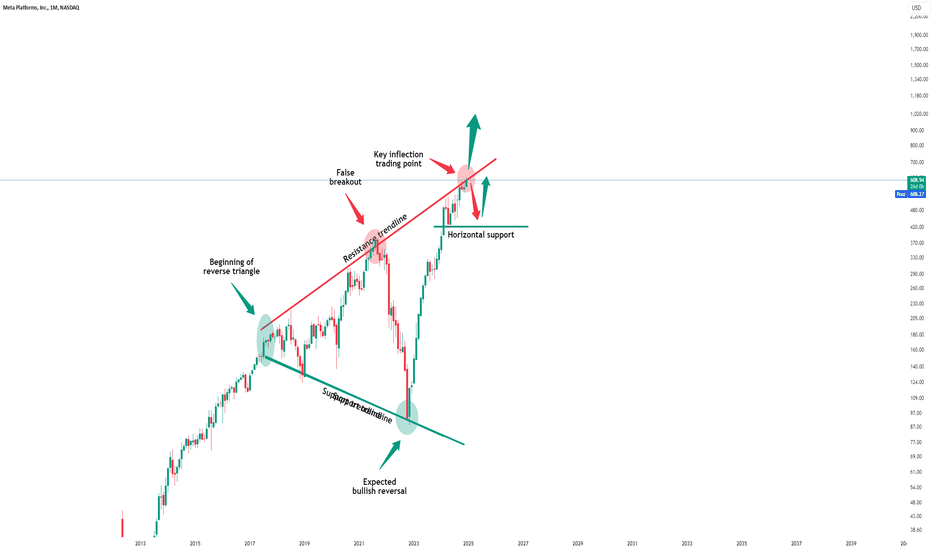
Meta ( NASDAQ:META ) could actually break the resistance trendline: Click chart above to see the detailed analysis👆🏻 As we are speaking, Meta is actually retesting the major (and only) resistance trendline of the reverse triangle pattern. If we actually see the bullish breakout - which obviously has to then be confirmed - this triangle breakout could lead to an immediate rally of more than +40%. Levels to watch: $650, $1.000 Keep your long term vision, Philip (BasicTrading)
Read More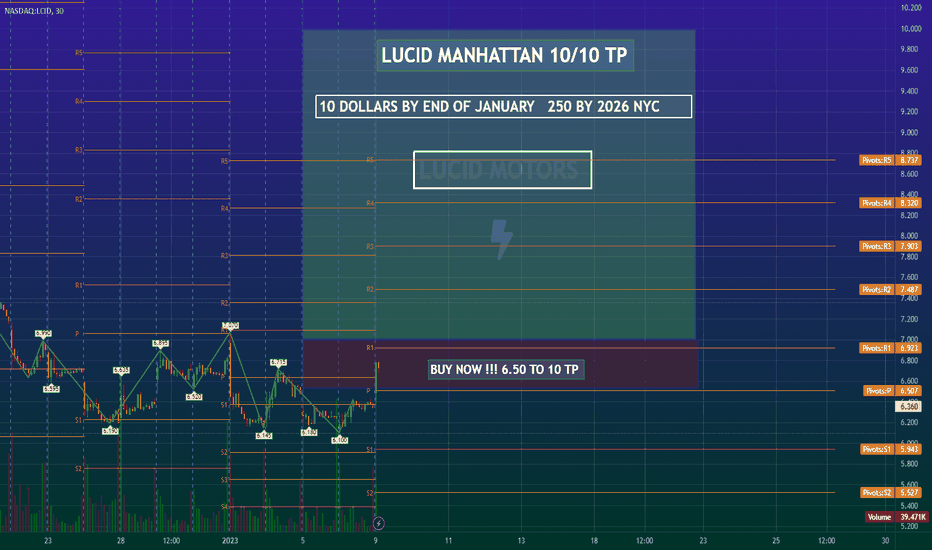
Lucid is going like Tesla sience in 2026 all cars in US must be Electric there is no way that Lucid will fail !! LUCID 10 DOLLARS BY END OF JANUARY Lucid 100 or 200 by 2026 !! The Future is Electric !!!
Read More
-- Bitcoin slipped on Wednesday after a three-day winning streak and a record high, as the digital currency saw profit-taking ahead of a Federal Reserve interest rate...
Read More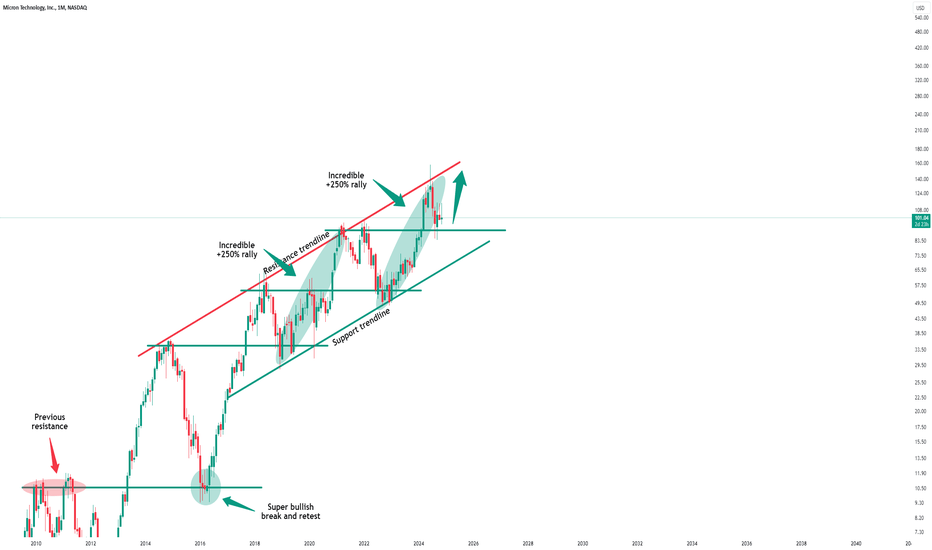
Micron Technology ( NASDAQ:MU ) is retesting massive support: Click chart above to see the detailed analysis👆🏻 After we saw a test of the resistance trendline on Micron Technology a couple of months ago, it was quite likely that we will eventually retest the previous all time high. This structure is now acting as massive support and together with the rising trendline, we will see a bullish rejection. Levels to watch: $90, $180 Keep your long term vision, Philip (BasicTrading)
Read More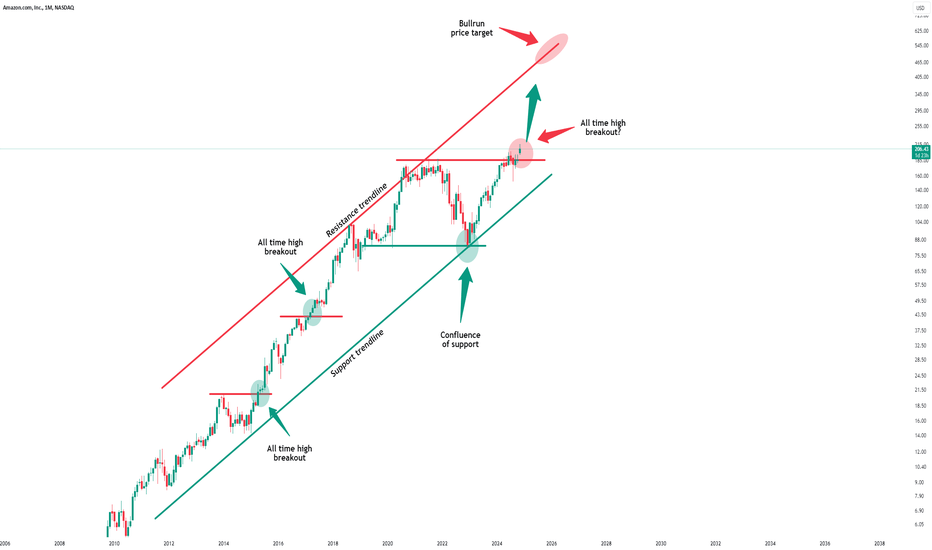
Amazon ( NASDAQ:AMZN ) is creating a major breakout: Click chart above to see the detailed analysis👆🏻 With this monthly candle, Amazon is finally breaking above the previous all time highs and could therefore start the next major bullish cycle. After a 5 year consolidation, a confirmed breakout will lead to an unbelievable short squeeze, which could bring us all the way up to the top of the channel. Levels to watch: $200, $500 Keep your long term vision, Philip (BasicTrading)
Read More
The WNBA’s announced crackdown on racism at games and online has received the full-throated support …
Read More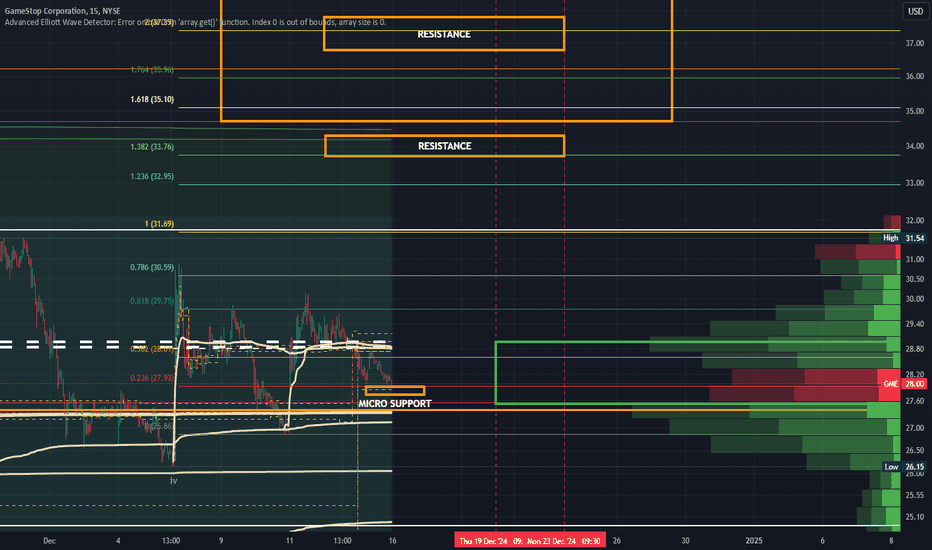
TLDR: BOOM!!! Volume Point of Control (VPOC) is critical to watch as well VPOC tracks the major waves in the wave cycle and will sit between major waves VPOC and where it sits in relation to price, like VWAP, helps us track the progression of waves Next move will take us to the 35-40 region Price will then retrace back to the 28 region which is where we will see an EXPLOSION IN PRICE That move back to 28 will be your last time, maybe ever, to get GME at anything near these levels The next move after the retracement to 28 takes us to 70 After 70 comes CHEERS EVERYBODY!!!
Read More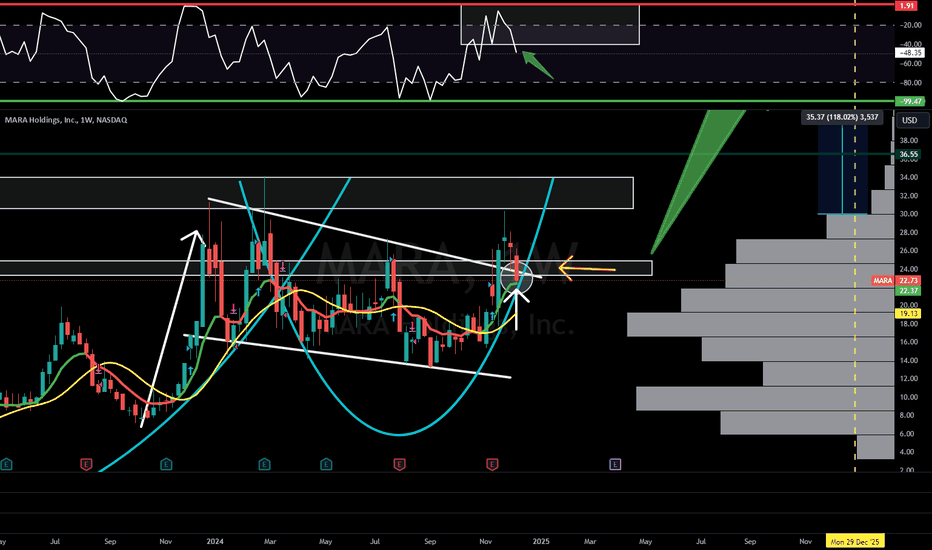
🚨 Get Ready for a MASSIVE Week Ahead! 🚨 Don't miss out on preparing for the upcoming week and the year-end Santa Claus Rally! Make sure to watch this entire video to stay ahead of the game. 📊 In this video, we'll cover: -Major economic news and events -Market trends for NASDAQ:QQQ , AMEX:SPY , and AMEX:IWM -Latest updates on all current H5 Trades such as NYSE:HIMS NASDAQ:MBLY NYSE:SQ NASDAQ:MARA NYSE:FUBO & more! This video is JAM-PACKED with insights and valuable gems you don't want to miss! 💎 Buckle up and check it out now! 👇
Read More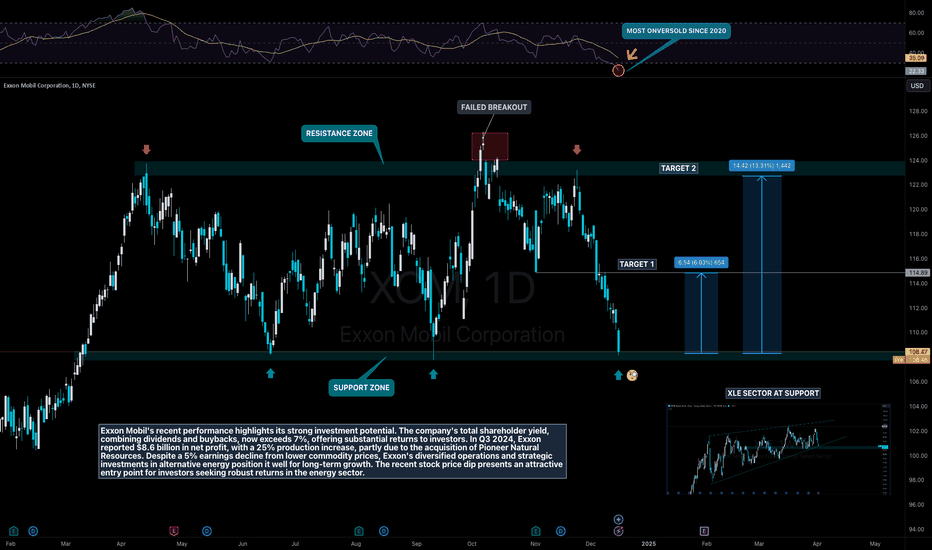
NYSE:XOM is inside it's sideways channel since March 2024 and trades within a price range of $108 - $123 with one failed breakout to the upper side in October. The recent pulldown came from commodity prices (oil) and political drama about how much oil will be offered in Trump's term. Of course, it would be best if supply will not outpace demand too much since this would let oil prices drop. Trump will learn this soon enough. Because of that it's mostly noise what we have seen in this chart. The level at $108 offered strong support twice and the sector (XLE) is also offering support itself. Also, the last time we've seen this stock so oversold was during the Covid crash in 2020. From a fundamental perspective, Exxon Mobil's recent performance highlights its strong investment potential. The company's total shareholder yield, combining dividends and buybacks, now exceeds 7%, offering substantial returns to investors. In Q3 2024, Exxon reported $8.6 billion in net profit, with a 25% production increase, partly due to the acquisition of Pioneer Natural Resources. Despite a 5% earnings decline from lower commodity prices, Exxon's diversified operations and strategic investments in alternative energy position it well for long-term growth. The recent stock price dip presents an attractive entry point for investors seeking robust returns in the energy sector. Target Zones $114.00 $123.00 Support Zones $108.00
Read More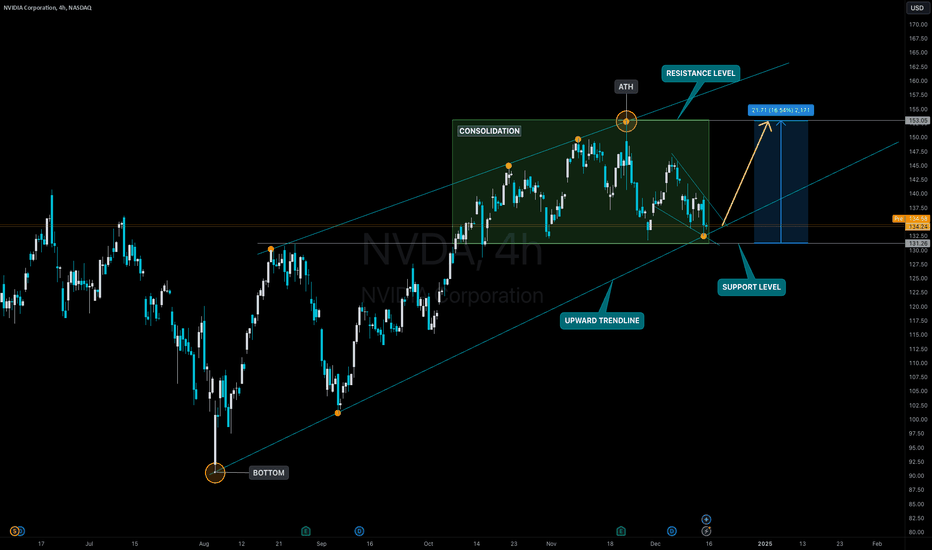
With NASDAQ:NVDA , we are currently in a promising position to see a final exaggeration into the end of the year. The stock has risen over 180% percent in 2024 and I think we have a good chance to make 200% out of that. Looking at the chart we can see a clear uptrend trendline starting in August this year with multiple touchpoints along the line. Since October we're consolidating within the range from $131 to $153. After touching the trendline on thursday last week we're good to go higher (at least for now). Resistance will be the current ATH at $153. If we fail to hold the level at $131 on the daily chart the trade will be invalidated. That leaves us with 16.54% ROI in total. Target Zone $153.00 Support Zone $131.00
Read More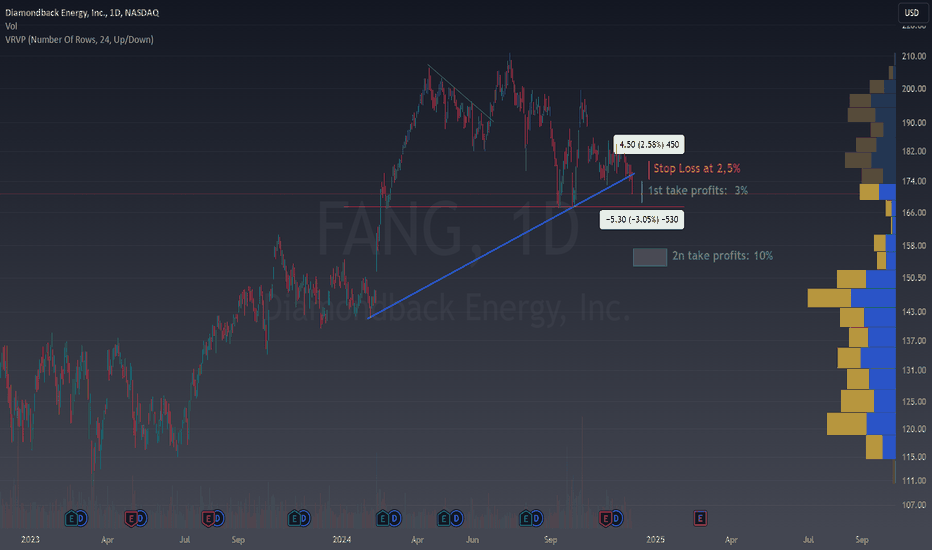
🟢 Easy idea on FANG for 10% returns NASDAQ:FANG is offering today a 10% returns opportunity risking just 2,5% in the deal. Furthermore, FANG has multiple patterns supporting this. As a bonus point, I will explain how to do this trade RISK-FREE. ✅ What pattern is unfolding in FANG? FANG has broken a minor blue trendline meaning that the price should fall at least until the first serious support (the red line). If this red line is also broken, we have a potential 10% decline. 💰 How to trade this chart pattern? Selling when the blue line is broken is the most optimal idea. To be sure that I do not fail, I will split my position in 2 take profits, so at least I can pay my stop loss and enter a risk-free trade. 🛡️ The risk management strategy As we have done in so many previous ideas, remember you can split the position in 2. - 50% of the position in a take profits, at least, as large as your stop loss (adapt SL and this 1st TP to local supports/resistance levels). In this case, a 3% TP for 2,5% SL (see the chart) - 50% of the position to a price as large as the previous pattern, which would mean a profit of 10%. ✴️ ENJOY AND FOLLOW for more 😊
Read More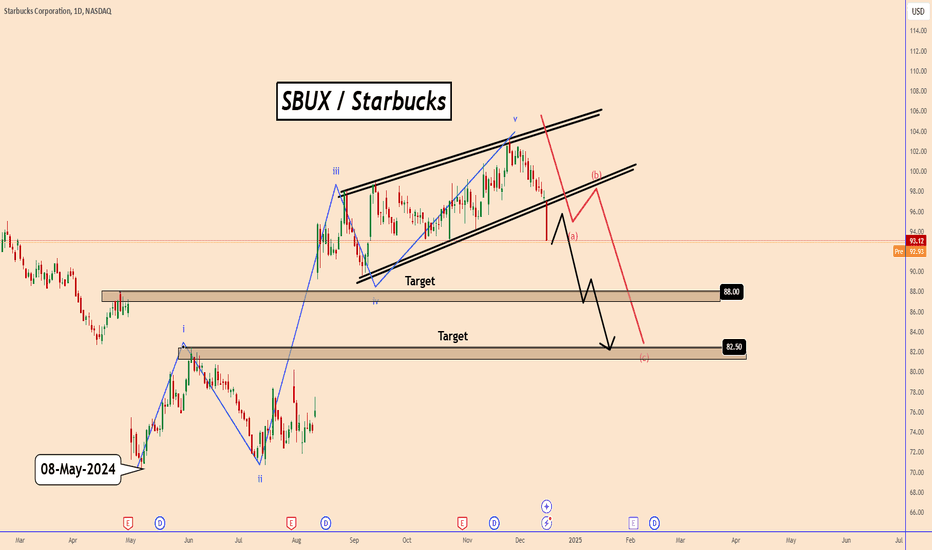
Starbucks: A Bearish Outlook Starbucks completed a five-wave pattern at 103, with the price moving down clearly. A large Rising Wedge pattern represents the fifth wave of the movement that began on May 2024 and finished at the end of November 2024 Currently, the price has broken through the support line of the pattern, indicating further decline. After any small correction, we should see SBUX moving down to 88 and 82.5. You may find more details in the chart! Thank you and Good Luck! ❤️PS: Please support with a like or comment if you find this analysis useful for your trading day❤️
Read More
Binance founder Changpeng Zhao was released early from custody on Sept. 27, and the price …
Read More